These are the water quality indicators used for the Watershed Health Assessments. If you're looking for more detail, you're in the right place!
Water quality indicators in detail
Ammonia is a type of nitrogen present in fertilizers and cleaning solutions, and is a decomposition product of urine. It can be toxic to fish and humans at certain levels and is often an indicator of human sewage in urban areas.
Conductivity, or specific conductance, is a measurement of the stream’s ability to carry an electrical current. In streams, this is related to the concentration of inorganic dissolved solid ions present in the water. This may include a number of nutrients, metals, or other compounds. Geology as well as pollutants can contribute to this measurement, but high measurements can make conditions unfit for certain aquatic organisms.
Dissolved oxygen is a measure of the amount of oxygen available in streams. These oxygen levels are essential in order for aquatic life to “breathe.” High levels of dissolved oxygen are typically good for aquatic life, and low levels may cause suffocation or death to aquatic organisms. In conditions where aquatic plants are abundant, low oxygen levels and impairment to streams may occur, particularly at night.
One indicator of the health of Lexington’s streams is the abundance, distribution, and diversity of fish populations. We survey fish using an electrofishing and seining or netting technique. With electrofishing, the fish are temporarily stunned and collected with a net. The stunned fish are then placed in a live well or bucket for preservation and identification. After, released back into the stream, unharmed.
We follow the Index of Biotic Integrity (IBI) to assess the fish community health. The IBI measures richness and abundance of the various fish species. This measure of stream health also measures the presence or absence of indicator species. These fish closely identify a trait of a stream, so the are closely tied to the stream health. We have collected over 40 species of fish Fayette county streams.
Nutrients, including nitrogen and phosphorus, are essential for plant and animal growth and nourishment, but the overabundance of these nutrients in water can cause a number of adverse health and ecological effects. Although nitrogen is abundant naturally in the environment, high levels are commonly due sewage, fertilizers, cleaning solutions, animal manure, acid rain, decomposition, and soil erosion. Commons sources of phosphorus include fertilizers, manure, sewage, industrial effluents, and soil erosion.
pH is a measure of how acidic or alkaline the water is. Either high or low pH can cause impairment to the stream.
Suspended Solids is a measurement of small particles, often called silt or sand, which are floating or suspended in the water and not settled on the bottom. Suspended solids can clog fish gills, reduce the ability of aquatic vegetation to grow, and will eventually settle on the stream bottom covering places where aquatic bugs or fish might live.
Health assessment scoring
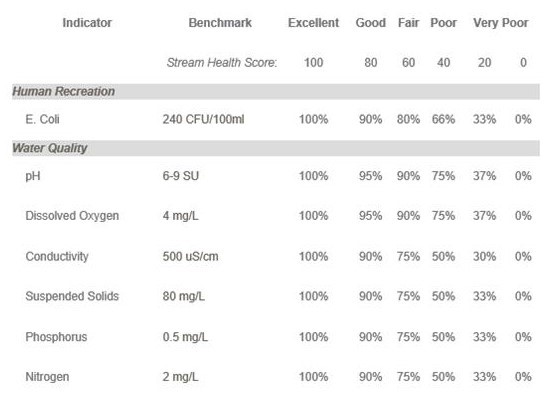
Stream health scores for pathogen indicators (E. coli) and chemical constituents are calculated by evaluating the frequency of benchmark exceedance, where the stream health metrics are judged against set established standards. For instance, the standard for dissolved oxygen is 4 mg/l (milligrams per liter), so if dissolved oxygen is measured to be higher than 4 mg/L that is better than it being lower than 4 mg/L, because like humans, fish need oxygen to survive.
Under this method, the metrics translate the collected data into a rating as the stream health score. On a range of 0-100, each rating applies to a range of twenty points. An 'Excellent' is assigned to a score that falls within the 80 – 100 range, while a ‘Very Poor’ is assigned to a score in the 0 – 20 range. Also for high and low results within each category, +/- designations are assigned.
For human recreation (pathogen indicators / E. coli) or Water Quality (chemical constituents) metrics, we compare the monitoring results to regulatory or scientific benchmarks. Streams are assessed on a score based on the frequency at which the given benchmark is met. The following table shows the benchmarks for the applicable parameters. We established the thresholds for each range based on the Kentucky Division of Water's criteria for their 305(b) Report, where applicable, or based on best scientific/professional judgment.
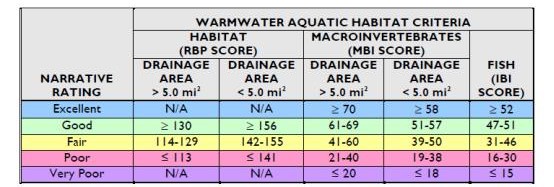
For habitat, aquatic bugs (a.k.a. macroinvertebrates), and fish indicators, the Kentucky Division of Water developed multi-metric indices which indicate overall stream health. These indices are the Rapid Bioassessment Protocol (RBP) for habitat, Macroinvertebrate Biotic Index (MBI) for aquatic bugs, and the Index of Biotic Integrity (IBI) for fish. We used the criteria for the Bluegrass Bioregion to assign the rating categories shown in the following table. The ratings assigned to habitat and aquatic bug scores vary based on the size of the watershed (in acres) draining to the sampling location.